Pilot investigation of
automatic comparison of striation marks with structured light
Zeno
Geradts*, Dennis Zaal, Huub Hardy, Jos
Lelieveld, Ies Keereweer, Jurrien Bijhold
Netherlands Forensic
Institute
Volmerlaan 17
2288 GD Rijswijk
Netherlands
ABSTRACT
We have developed and tested an algorithm that can
compare striation marks that are acquired with a standard camera and sidelight
as well as 3D- information acquired with structured light.
With six different screwdrivers test marks have been made with an
angle of 45 degrees to the surface. These striation marks are moulded with gray
silicon casting material. Then these marks are digitized with the structured
light approach and with side light. For
the structured light approach, it appeared that there are artifacts and
variations in the image due to the number of stripes in the LCD projections and
the camera resolution. We have compensated for these variations by averaging
the lines over an area that is selected by the user. In the method that has
been used for averaging, the slopes of the striae are followed. This method is
also used for side light images to compensate for variations in the striation
mark.
In this research, signatures of the tool marks are
calculated then compared with a database of signatures by calculating the
standard deviation of the difference.
For the limited test set of six striation marks made with six different
screwdrivers, the algorithm was able to distinguish the global shape of the
screwdriver and the depth information itself.
Since the images acquired with structured light contain more information
on the toolmark itself, the correlation results were better than with side
light images.
Keywords: Structured light, correlation algorithms, 3D, tool
marks, forensic
1. Introduction
Tool marks are often found
at the scene of crime. They can appear in a wide variety of shapes depending on
the tool and the surfaces where the tool mark is formed. Often pliers,
screwdrivers or crowbars are used for entering a building for a burglary. These
tools will cause tool marks that appear in different shapes: striation marks
and impression marks. In several police regions in the Netherlands the images
of the tool marks that are found at the scene of crime are stored in a
database, and when a suspect has been found with tools, test marks are made
with these tools and compared with the database. In figure 1 an example is
shown of a striation and impression mark in a police database.
The
tool marks in the database are created by a procedure. A casting is made with a
gray silicon casting material, and subsequently these images are stored in the
database. The database is used for pre-selection, and subsequently the real
toolmark is compared with a test mark of the tool on a comparison microscope by
a qualified examiner.
In
this research we focus on striation marks, since they are most time-consuming
for an examiner making a comparison. The tool can have many different angles to
the surface, and for each angle a different striation mark is formed. For this
reason the examiner has to make several test striation marks with different
angles of the tool. In the case of a screwdriver, the examiner will make at
least four test striation marks under different angles for each side of the
screwdriver. All of these test marks have to be compared with the striation
marks.
Striation
marks are caused by irregularities in the upper part of the blade of the
screwdriver when scraping off material of a surface that is softer than the
tool itself. If the irregularities in the upper part of the blade of the
screwdriver are damaged or have grinding marks these can be characteristics of
the tool that has been used. Depending on these damages and grinding marks, and
the quality of the toolmark itself, a qualified examiner can conclude that the
blade of the screwdriver has caused the striation mark.

Figure 1: Tool marks in database. Left:
striation mark; right: impression mark.
A difficulty with forensic
examination is that the toolmark found at the scene of crime might be partial.
In this case the striation mark should be matched to the test striation mark.
Furthermore the screwdriver could be damaged in the meantime because it has
been used, and this will cause the striation marks to differ. Also the
striation mark can be (partially) zoomed because of stretch or shrinkage of the
material (e.g. elastic deformation) in which the tool mark has been formed. And
finally the angle as shown in figure 2 might also give a gradient in the
toolmark.
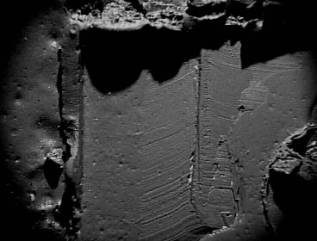
Figure 2: Example of angle of screwdriver
and influence on the striation mark. Furthermore a partial striation mark is
visible in this image.
In the past[1]
we have developed a comparison algorithm that takes all these variations into
account. In this research the method for taking a signature that has to be
compared to the database is improved. Furthermore we focus on the structured
light approach.
2. Side Light
Dull
surfaces, such as the gray casting material reflect light with the same
intensity in all directions[2].
Diffuse reflection is sometimes also called Lambertian reflection because
Lambert’s is used to calculate the intensity of the reflected light. Lambert’s
law states that the intensity of the reflected light is proportional to the
cosine of the angle θ between the light vector L and the surface normal N
(figure 3).
Figure 3 : Lambert’s law; The angle θ
between the light vector L and the normal N determines the intensity of the
light reflected from the surface.
Lambert’s law can be formulated
as
![]() (1)
(1)
Ip is the color
of the light source and kd, the diffuse-reflection coefficient, is a
material property varying between zero and one. The angle q must be between 0°
and 90°. The surface will otherwise be directed from the light source and
shadowed. The direction to the observer is irrelevant since the light is
reflected equally in all directions from the surface.
If both N and L are
normalized, the equation can be simplified by computing cos θ as the
product of N and L:
![]() (2)
(2)
We can see that we very
much depend on the light condition in this approach. For this reason under
different light circumstances or light variations due to the surface itself,
the striation mark might appear differently.
This is one of the reasons
to choose for an approach using 3D images. The method that we used is the
structured light approach. With this method it is possible to acquire a
3D-image in a few seconds. This method is faster than the implementations of
laser triangulation methods11 that scan a surface that we have tested in the past.
3. Structured light approach
The structured light
system is similar to the passive stereovision system with one camera replaced
by a projector. A light source projects a vertical plane of light that creates
narrow stripes on the scene. Since the intersection of an illumination plane of
known position and a line of sight determines a point, the 3D-location of all
points along that illuminated stripe that are visible by the camera can be
obtained from a single image. For dense reconstruction the scene must be
accurately scanned and many images should be taken.
High
reliability identification of light planes with minimal assumptions on the
nature of the scene is achieved by sequentially projecting several patterns. A
robust and widely applied structured light system is based on spatio-temporal
modulation has been described by Kato[3].
Gray codes are used to label light planes, and each illumination pattern
represents one of the bit planes of the Gray code labels.
In
our approach we used the structured light system of OMECA[4]
that is based on this research. In this system lines are projected on the
surface by means of a micro mirror device that can be operated by the computer.
The system consists of a CCD-camera, a frame grabber and a computer that will
control the stripes that are projected, and calculate the depth of the surface.
The advantage of the micro mirror projector compared to the LCD-projector is
that we have a higher light intensity and that the pattern itself has more
contrast. The method implemented will also cover problems with dark places of
the object. In figure 4 the apparatus is shown as used in our laboratory. With
this method it is possible to measure a striation pattern with a precision of
several microns[5].

Figure 4: OMECA structured light equipment.
4. Correlation algorithms
For the correlation of
tool marks several methods are described in literature[6]
[7]
[8]
[9].
In the past we have also examined if the output from a human examiner could be
used in a neural network, however this method did not work for practical cases [10]
other than in the database. The study of De Kinder[11] is focused on using 3D laser
triangulation for bullets, since similar correlation algorithms can be used.
Commercial systems exist
on the market for automatic toolmark comparison [12]
and IBIS[13]
for bullets. The system for bullets will extract a signature of the striation
mark and compare these. For bullets, the bullet it is recommended they be the
same composition, since otherwise differences in the striation marks might
result depending on differences in hardness of the material. One advantage with
bullets compared to tool marks with screwdrivers is that the striation marks
are more reproducible, since most often the bullet can only leave the firearm
in one direction. With tool striation marks it is often not known which angle
is needed to reproduce the mark.
For the speed of the
algorithm for the correlation of striation marks it is most optimal to have a
short signature with which to compare the database. The advantages of this
method are that we can combine the surface of a striation mark to a
one-dimensional string of gray values or depth information. In this way
artifacts of the surface can be averaged. For the explanation of the algorithm
we will continue in gray values, however instead of gray values, one can also
read depth-values.
Our improved algorithm
will follow the striation lines, and then sample a signature of gray values
with the following approach:
The user selects an area
of the toolmark that should be sampled manually. The reason for user
interaction is that the user can determine which part belongs to the striation
mark, and which part belongs to damages or other artifacts.
We assume that the
striation lines are horizontally placed in the image, however it is nearly
impossible to place them exactly horizontal. For this reason we will follow the
striation lines (or depth information), and calculate the signature from this.
The area that is selected
should contain the visible striation mark. Furthermore the user should validate
the final signature that is calculated by the algorithm.
In our previous approach
we would just average all gray values. If we have an image g(x,y) were g(x,y)
is the grey value of the image at position x,y, we can average the gray values
for N vertical lines, we have a signature :
 (3)
(3)
However the problem with this
approach is that all striation lines should be horizontal. To compensate for
this, we have developed a method that will follow the striation lines
themselves.
This
method will work on a basis of 2x3 pixel matrix. We take the line g(x) out of
the image and compare it to g(x,y) by three pixels. We average the gray values
of g(x,y) with g(x,y+1). Furthermore we make a second line that is shifted
g(x+1, y+1/2). This is conducted by averaging g(x,y+1) with g(x, y):
![]() (4)
(4)
We also compare these gray
values with each other, and calculate the same for g(x,y-1/2) and g(x,y-1).
In table 1 an example is
given of comparing two lines.
Table 1: Example of comparing two lines with the adaptive zoom
algorithm. The shift of –1/2 will result in the best result for this case for a
gray value of 150 in line 1.
|
Line 1 g(x,y) |
Difference |
Line 2 g(x+1,y) |
|
|
50 |
75 |
75 |
G(x+1,y-1) |
|
100 |
0 |
150 |
G(x+1,y-1/2) |
|
150 |
-25 |
175 |
G(x+1,y) |
|
200 |
-75 |
225 |
G(x+1,y+1/2) |
|
250 |
-125 |
275 |
G(x+1,y+1) |
Then we shift a pixel and do
the same for g(x+1,y+1). If the difference between the pixels is better when
shifting y-1/2, this

Figure 5: The result of sampling an area of a striation mark in a
striation mark digitized with the OMECA.
will be done the second time
that the values are approaching to each other. In this way this sampling method
is repeated for all lines that were selected. Finally the average signature is
displayed, and the user can validate to result. In figure 4 an example is shown
using this algorithm for a 3D-profile that is displayed in gray values (figure
5). The user can check if the resulting signature is characteristic for the
striation mark by checking the striation match.
A problem still remains for
the 3D-case if there is a slope in the z-direction. In figure 6 an example is
shown of an image with a slope in the z direction. Since this slope is linear
(it is caused by the fact that the cast is not completely flat on the surface),
the user can select the edges of the tool mark in both direction and then we
compensate for the tilt by assuming the slope is linear, and subtracting the
relative differences of the four points with a linear algorithm.

Figure 6: 3D-image of a toolmark with a slope in x and
y-direction
By calculating the standard
deviation of the difference and shifting the tool marks relatively to each
other in the memory of the computer, we can compare the complete database. The
results will be a list of matches based with the marks with the lowest standard
deviation of the difference at the top of the list.
5. Experiments
testset
A small test has been
prepared in which six screwdrivers are used. Of these six screwdrivers test
marks were made with an angle of 45 degrees on wax. These striation marks were
molded with gray silicon casting material. Then these marks were digitized with
the structured light approach and with side light. It appeared that there are some artifacts and variations in the
image due to: the largest number of stripes in the LCD projections, camera
resolution and variations in the toolmark itself.
Since the current setup of
our OMECA-structured light apparatus is limited to 6 mm, a part of the
striation mark has been scanned. For each striation mark we have chosen to scan
one edge with lines.
RESULTS
The results of correlation with the standard deviation
of the difference are shown in tables 1 and 2. From this experiment it appeared
that all tool marks that were compared to each other, were retrieved well. If
we compare the results of the gray value images with the 3D-images, the
algorithm will distinguish the striation marks with, on average, a 30 percent
higher correlation factor (in our approach this is the standard deviation of
the difference).
Table
1 : Correlation factors for gray value comparisons of the six screwdrivers
|
|
1 |
2 |
3 |
4 |
5 |
6 |
|
1 |
17.3 |
43.5 |
74.2 |
61.3 |
51.3 |
54.5 |
|
2 |
68.6 |
27.7 |
46.3 |
55.3 |
78.3 |
62.4 |
|
3 |
40.4 |
58.7 |
15.4 |
79.1 |
40.3 |
73.5 |
|
4 |
48.0 |
45.7 |
39.8 |
20.2 |
36.8 |
86.9 |
|
5 |
54.3 |
80.7 |
59.6 |
45.2 |
23.2 |
86.4 |
|
6 |
67.4 |
71.5 |
83.8 |
42.0 |
62.3 |
20.6 |
Table 2: Correlation factors for structured
light comparison of the six screwdrivers
|
|
1 |
2 |
3 |
4 |
5 |
6 |
|
1 |
16.0 |
47.7 |
81.2 |
114.4 |
44.4 |
107.0 |
|
2 |
55.8 |
25.6 |
71.8 |
113.7 |
82.1 |
110.8 |
|
3 |
81.3 |
47.4 |
20.8 |
66.8 |
47.3 |
104.5 |
|
4 |
101.8 |
103.4 |
56.4 |
17.5 |
70.2 |
70.2 |
|
5 |
91.2 |
90.4 |
100.0 |
89.3 |
13.4 |
97.5 |
|
6 |
92.8 |
88.3 |
113.7 |
83.0 |
97.3 |
11.8 |
6. ConclusionS and discussion
Based on this research it
appears that the use of three-dimensional information of a striation mark is
useful compared to the two-dimensional side light image because we have a
measurement of the depth information and are less sensitive to the influence of
lighting of the surface.
In
future research this method should be tested on larger databases of striation
marks. Comparing striation marks with the current set-up of the OMECA equipment
is not recommended because the area of scanning is limited to 6 mm. The
equipment should be modified before continuing with large-scale experiments.
A
different approach that might reduce the time of examination is digitizing the
shape of the blade of the screwdriver, and then comparing the striation marks
with the toolmark. In this case we would not have to make test marks anymore,
and less time is needed for making the comparison with the database (if a
proper way of digitizing the blade is used). Another area of research is the
impression marks and comparing them with the 3D data of the tool itself.
In
figure 7 is shown that the shape of the blade of the screwdriver might also be
used for distinguishing the toolmark easily. In this way a fast pre-selection
is possible based on a small signature of the shape of the blade.

Figure 7: Shape of the upper part of the blade of the
screwdriver visualized in 3D-information
Acknowledgements
The authors would like to
thank Leszek Luchowski for the interesting discussions on toolmark comparison
and the European project IITTIS-MMACH were we cooperated together in using new
search algorithms. We would like to thank Jense Abma and his colleagues of the
police in Alkmaar for filling a database of tool marks and making this
available our institute.
REFERENCES