Pattern
recognition and image processing in forensic science
Zeno Geradts / Jurrien Bijhold
Netherlands Forensic Institute
Volmerlaan 17
2288 GD Rijswijk
Netherlands
Abstract
In forensic laboratories, image
processing and pattern recognition in image databases is given more attention
for solving crime cases. In this paper a wide range of examples of forensic
image processing and pattern recognition method is given.
Keywords : forensic science, image databases, restoration, super
resolution
1 Introduction
The development of new techniques in image processing and pattern recognition has much influence on forensic science.
By the number of camera surveillance systems that are installed it sometimes happens that a crime is recorded on videotape. If this occurs the tape can be used as evidence in court. The court often asks for image processing of the tape itself, to get a clearer image of the tape, and of comparison of the video images with a suspect. Furthermore the court sometimes asks if an image has been manipulated.
The second part of this paper covers pattern recognition in forensic image databases. Since there exist many kind of image databases (where the fingerprints are the most well known), there is a need for searching on image features. The databases that we have investigated are : shoeprints, toolmarks, handwriting, cartridge cases and drugs pills.
In this paper a short overview will be given to the different techniques that are developed and used in the forensic laboratory.
2 (Video) Image processing
Questions that are asked to our forensic imaging department by the court deal with :
· image enhancement
· Visualization of images for the court
· image comparison
· video tape integrity
· Camera identification
2.1 Image Enhancement
Surveillance video images often have a poor quality. This is caused by light conditions, the resolution of the system and tape wear. In practice it is rarely that image processing (apart from contrast stretching) improves the quality with these kinds of images on a single image.
In the past [Bijhold 1997][i] we have investigated the different kinds of image restoration based on Wiener Restoration, Maximum Entropy and PDE’s for still images. For artificial images this worked, however for real images it does not often work. For a sequence of images, the contents of these images can be combined in a final image, which is named the super resolution method.

In figure 1 an example of a surveillance image is shown. In this image there were questions to visualize the number plates and to identify the persons, or to have magnification of the faces.
2.2 Hardware and Software at the laboratory
For the digitization of video images, we prefer to use uncompressed movies. This means that the data streams that should be handled are 30 MB/s. Furthermore there are also different options for digitizing. One can digitize 8 bits or 10 bits of information. The reason not to have compression is that the higher compression methods will often result in loss of quality. This could result in court that we have to explain exactly which artifacts can result from the compression method, or that otherwise the evidence will be rejected in the court. Since most often the time that needs to be analyzed, is a few minutes (robberies etc rarely take more time), we choose for uncompressed data streams. Furthermore a Time Base Corrector (TBC) has to be implemented in the system to compensate for stretches in the tape. If we choose to digitize 10 bits, the TBC should also handle 10 bits of information.
Furthermore we prefer to have source codes of the software that is used, and know exactly which image processing methods are implemented in the software. For this reason we have chosen for a Unix-based solution where we can use scripts, ImageMagick and Khoros software were the source code is available. Often for processing a sequence of images, it is necessary to develop some own algorithms to analyze the processes. Furthermore with our own software, we can validate commercial packages, like Video Investigator of Cognitech.
2.3 Surveillance systems
In practice we see that often time-lapse tapes are submitted to the laboratory. The reason is that the videotape should handle more than two hours, because otherwise the handling of the tapes becomes inconvenient for the operators in shops and banks. Often the tape will cover 48 hours, however this means that less images per second are recorded than the normal 25 for PAL. For a tape of 48 hours, 1 frame per second is recorded.
Also the surveillance system often records more than one camera that should be recorded on one tape. For this reason the next systems are often found at the crime scene [Geradts; 1999][ii]:
· Sequential Switchers: the cameras are recorded on the tape in a sequential method. This means if there are four cameras, that several frames on the tape will cover the same video camera
· Multiplexers: the cameras are recorded on the tape often in fields. This means that each field will cover one camera. With these systems many (4 – 16 or even more) cameras can be recorded on one tape. The system is often combined with an alarm system, in such a way that more images are recorded if there is movement at the place the camera is recording
· Quad Compressors: This is the oldest system, in which the image is divided in four parts, and each part will cover another camera
Nowadays we also see many digital systems. Since there are no standards yet on these digital systems, they can be hard to handle at the forensic institute. Often the system itself should be seen, before the optimal images are acquired. The digital systems can either be a hard disk with JPEG compressed images, or digital tapes. Often these systems will have many options for the operators, where the number of images per seconds and different actions for the alarms can be set.
On the market many different kinds of multiplexing systems exist. For this reason it is necessary to split the different camera images, in such a way that one camera is visualized. For this reason we have developed a method for splitting the camera sequences. At first this was done manually, however since we often have to deal with over thousand images, it is easier to have an automatic algorithm implemented for the selection.
One of the methods was just by calculating the standard deviation of the difference of the subsequent images. If this value is low, then we assume that the images belong to the same camera. With this method it is possible to make separate sequences of the cameras. We have used this for over 10.000 images. Other approaches are just by using commercial image databases and search algorithms, however if the different cameras contain information that varies rapidly, only a part of the image should be taken for the algorithm. If there exist much fluctuation in the images themselves, since algorithm might not work.
2.4 Noise removal
There exist many kinds of noise in a surveillance system, however the next kinds are distinguished for the video system if noise is introduced by playing and digitization, it might be worthwhile to play the recording more often and average the final result. One danger with this method is however that the tape can be damaged if it is played more often.
Averaging over multiple frames can also reduce the noise. This can be valuable if there is a night recording with a camera and a scene that does not move. One problem is however if people move, as seen in figure 2, that the people are not visible anymore. The value of this method depends on the part of the image that has to be visualized.

Super resolution is also a challenging field in forensic science. The idea is
that if there is small movement in the image, that a higher resolution image
can be calculated based on a sequence of images. The camera or the scene itself
should move to calculate such a super resolution image.
For validation of this method in court we tested it on Dutch license plates with known numbers. The way we calculated the super resolution image as follows:
•Magnify the images with an interpolation method, which takes sub pixel resolution into,
account
•Register the images by the information that is available in the image itself
|
|

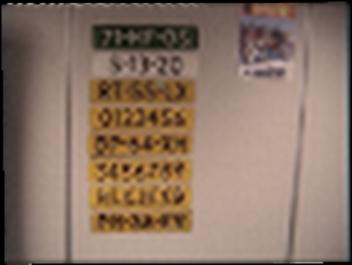
Figure 3 : left side : one frame; right : super
resolution of known license plates
2.5 Super resolution
In figure 3 an example is shown with super resolution of a known license plate. The numbers are becoming clearer. The registration method is calculating the minimum of the standard deviation of the subsequent differences in the image.
This method is also implemented in commercial software, and other methods of super resolution are becoming available to forensic science.
However, sometimes it appears not to work, as is shown in figure 4. This was an compressed sequence, and due to image compression, artifacts in the super resolution image are introduced.
|
Figure 3
|

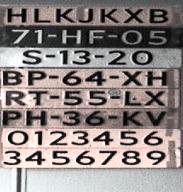
Figure 4 : Fifty frames of a compressed video (left) are averaged and registered to form a super resolution image (middle). At the right the original number plates are shown. The ‘D’ in the third license plate appears to be a ‘B’ in reality.
Super resolution will take a lot of computing power, and faster approaches of the calculation of registration are needed. At the moment we are reluctant to use this method in the court, since first more steps of validation have to be tested.
2.6 Image restoration
In the past we have done some research on image restoration of a video sequence by calculating the movement or the blur of a lens system [Bijhold, 1997]. These approaches do most often not work, since the blur function is not known. We have worked with different kinds of Wiener Restoration and Partial Differential Equations. In examples that we created ourselves this worked, however in real casework we hardly ever can use these algorithms.
2.7 Tracking
Other research that we are into is tracking person in a video sequence [Geradts, 1999]. This might be useful if the court asks for magnification of a sequence of images, since otherwise it takes to much time to work on the case manually.
2.8 3D-reconstruction
For the comparison of a suspect with a video image there are several implementations.
One approach that7 we use is bringing the suspect to the same video recording
system, and asking the suspect to stand in the same position as the people that
were visible on the video recording. The problem with this approach is that the
place should be available (often they have rebuild the place or the shop owners
do not cooperate for emotional reasons) and that the suspect should cooperate,
since it would be very difficult to get the suspect in the same position if he
would not cooperate. Furthermore there should be other people who look similar
to the suspect available, since we can draw a conclusion about the uniqueness
of features that are combined.
The other way is by photogrammetry. This means that many parts of the scene have to be measured, and that the length and size of a suspect can be compared. We also used a human model that was available in a commercial software package, to determine the compare the sizes of the person.
In figure 5 an example of such a human model is shown with the real human being. In this way the length is measured. However it can be difficult to determine the real length, since there might be errors in the measurements, or there might be not enough reference points in the image. Furthermore if someone bows, it is not known how much it differs for the real length, and the influence of shoes-soles and head should be taken into account.
For this reason, although the 3D-images have a certain appeal to people’s imagination, these kinds of models should be validated for each image, before they can be used in court, or otherwise the evidence might not be accepted.
At the moment we have started a project in our laboratory to find out what kind of conclusions can be drawn from this kind of comparison. Furthermore we have studied the evidential value of gait in real time video tapes.
2.9 Output to court
The court should use the output in an easy and convenient way for their interpretation of what happened at the scene of crime. Often we will submit a written report with video prints to the court, however since they should watch the complete sequence, we will sometimes send a composite video. The problem with this is however that the lawyer might ask if there has been tampered with the digital evidence. So, we prefer to send a CD-ROM or DVD-ROM to the court with a hash-code based on SHA-1 of the movie-files that are on these discs.
2.10 Image Integrity
Images are known for manipulation for a long time. Compared to other evidence (e.g. DNA or fingerprints), the question often arises if there has been tampered with the images. For the analog videotapes we might investigate the signals, and we will say that the tape seems to be an original. If the tape has been tampered with a professional approach, we might not find out that it has been tampered.
One other problem that arises is with child pornography cases. In the Netherlands the possession of virtual child pornography is not illegal. Virtual child pornography means that there is a composition of a child and another occurrence in such a way that the child seems to be abused, however it never happened in reality. For this reason we had a case were the lawyer claimed that his entire client’s images that were send on the Internet were virtual. The court asked us if we could investigate for manipulation.
We could prove that some of the images were manipulated by examining the edges and the light effects. Since all images were compressed by a lossy compression scheme, it was hard to find the fine details in the image. However it is hard to say that an image has not been tampered. This can only be claimed by testimonies and other ways of investigations.
Other questions that arise if a certain videotape has been recorded with a certain VCR that is used as evidence. Often there are signals available in the tape were this information might be checked. However it is a weak kind of evidence.
A stronger kind of evidence is available with cameras. If the question arises if a camera has recorded a video image or a still image, there might be information in the image itself. One of the strongest kinds of evidence was found with pixel defects in a camera. We have tested some cheap digital camera’s and it appeared that there were enough pixel defects to identify the camera. In figure 6 an example is shown. Also camera’s might hide serial numbers in files or by stenography. These ideas are under research at the moment. For this reason digital systems might have good methods for authentication.
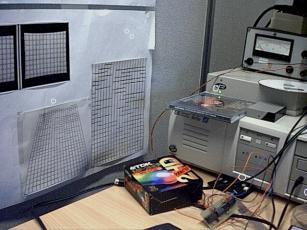
Figure 6 : Camera
Identification based on pixel defects
2.11 Conclusion
Video image processing is important in the court. However often the expectations are too high. The responsibility of the forensic examiner is to inform the court on the possibilities, limitations and the artifacts that might arise from image processing. Many image processing methods should be validated before being used in the court, since the risk exists that if a certain method is not accepted in the court it might be very hard to use the method again in the court in other cases, whereas it might have been a method that could be useful in forensic investigations.
3 Pattern Recognition
Pattern recognition in forensic science is often used in databases. This can be a database of DNA, fingerprints or paint. In this part we will focus on image databases of:
· Toolmarks
· Shoeprints
· Cartridge cases
· Drugs Pills
In all these databases the image has to be searched by query by example (QBE) framework for formulating similarity queries over the images [Huijsmans, 1999][iii]. In QBE a user formulates a query by providing an example of the object that is similar to the object the user would like to use. The oldest database in forensic science is the fingerprints database. Since there is a lot of information on these databases, in this chapter we discuss some background of the fingerprint work, before continuing with the separate databases.
The fingerprints are the most well known database and are used for many years now. The techniques are similar to other image database search methods. First the image acquisition is done, then the features are extracted from the digitize pattern and stored in a database. A matching algorithm is used in the database and then there is a decision of authentication depending on the amount of similarity.
In the commercial systems four major approaches are being used [Jain, 1999][iv] :
· Syntactic approach: the ridge patterns and minutiae are approximated by a string of primitives
· Structural approach: features based on minutiae are extracted and then represented using a graph data structure. Using the topology of the features does the matching
· Neural networks approach: a feature vector is constructed and classified by a neural network classifier
· Statistical classifier approach: statistical classifiers are used instead of neural network classifiers
In our research we have tested the different kinds of approaches.
3.1 Toolmarks
In toolmarks examination it is possible to determine if a tool has made a toolmark based on striation marks or impression marks. Often the tool (e.g. a screwdriver) has characteristic damages and manufacturing marks. These characteristics may cause that comparing a test mark made with the tool with the toolmark found at the crime scene identifies the toolmark. Often toolmarks are found at burglaries. For this reason the police will have a database of toolmarks to link the various burglaries that have been committed by a suspect.
In this part of the research we handled striation marks. For comparing the striation mark we take a signature of the mark itself. This signature is sampled by taken fifty vertical lines and following the striation mark of a screwdriver itself with an algorithm.

Figure 7: sampling
a signature of the striation mark of a screwdriver
In this way the user has to determine if the striation mark has been sampled correctly. Since a screwdriver can be positioned with different angles to the surface, at least five test striation marks should be made of each side of the tool in different angles. Since the user should compare all striation marks to the striation marks found at the crime scene, this work is very labor intensive. At least twenty comparisons have to be made for one screwdriver. The comparison with the complete database of all crimes that are committed, might take several days if it is done manually. A comparison algorithm is implemented that takes the fluctuations in marks, and allows partial zooming of ten percent. It appears that this algorithm works well for striation marks of good quality.
Furthermore tests are made with structured light [van Beest, 2000][v] to get a 3D-image of the striation mark. It appears that the shape of the tool itself can be digitized, and this might be easier for faster comparison, since otherwise all striation marks should be compared to each other, where also the shift and partial zooming has to be taken into account.
In the structured light approach, a sequence of different projection structures is created with a computer controlled micro-mirror projection. The whole procedure of projecting and grabbing the sequence of images takes a few seconds. The resulting images (object views) are processed and interpreted finally as one object view. In this resulting view the stripes carry the desired code numbers. Now remains to define the border lines in the image and to calculate the X, Y and Z-co-ordinates of the object surface points. The result can be viewed as a depth map (or image); it represents a 3D sampling of the surface. Accuracy and density of this method - known as Gray-Code-Projection depend on the largest number of stripes in the grids that could be handled by the camera system and by the accuracy of the geometric calibration. This information can be processed and visualized together with the 3D-data.
A small test has been carried out for toolmarks in which five screwdrivers are used. Of these five screwdrivers test marks were made with an angle of 45 degrees on wax service. These striation marks are molded with grey silicon casting material. Then these marks are digitized with the structured light approach and with side light.
It appeared that there are some variations and artifacts in the image due to:
· The largest number of stripes in the LCD-projections
· The camera resolution
· Variations in the toolmark itself
For the above reasons, we sampled in the direction perpendicular to the striation mark fifty lines, and averaged the values in such a way that the algorithm follows the striation lines.
When the depth-values are averaged in horizontal direction, the striation mark should be completely horizontal in the image. Since there is most often an angle in the mark, this should be compensated for. The algorithm follows the depth-values were each value is compared to the next line. When the screwdriver is moved, this might also be not completely straight, so for this reason the averaging should be adaptive to the mark. With our algorithm the signature of the mark can be calculated, which is a small file with depth-values that are representative to the depth values of the striation mark.
The way this algorithm works is by analyzing fifty lines of the image. One line contains the 512 pixels of depth information. The first line will be compared to the second, were the standard deviation of the difference of each pixel in a line is calculated. If the standard deviation is lower when a shift of one pixel is computed, then this shift is taken into account by the algorithm. Shifts of half a pixel are also possible with our algorithm. Then the averaged line will be compared to the third line, and also a shift of several pixels will be computed. A further improvement of this algorithm is also to allow shifts due to local variation in the striation mark. The averaged line results in the so-called “signature” of the striation mark. To validate the signature, the user can see the signature in comparison to the rest of the striation mark. Most optimal results can be obtained by manually selecting the area were the striation mark should be sampled.
The signatures can be compared with a database of signatures, just by calculating the standard deviation of the difference. Since there might be some shift, zoom and local variation in these, the algorithm also compensates in the same way as described above with the same algorithm.
It appeared that for the limited test set of six striation marks made with six different screw drivers that the algorithm was able to distinguish on :
- The global shape of the screwdriver
- The depth information itself.
Since the gray value contains more information on the toolmark itself, the correlation results were better than with gray value images of side light images. The comparison algorithms should be tested in databases that are filled by the police.
3.2 Shoeprints
Shoeprints are often found at the crime scene. It is hard for a suspect to hide shoeprints, since often they will be latent in dust and can be visualized with various techniques. For shoeprints several databases might be useful in forensic investigation:
1. Database of shoeprints found at the scene of crime
2. Database of shoes of suspects
3. Database of shoes on the market
The database of shoeprints found at the scene of crime can be useful to compare with the database of shoes of suspects. Since people change their shoes (because of wear), this database could be limited to 6 months to be useful in most cases. The database of the shoes that are on the market can be useful for finding which kind of brand and model the perpetrator might have worn. This database should be build somewhere centrally, since it takes much time to build such a database.

Figure 8: data
entry screen for shoes of suspects
For ease of processing and standardization, it is necessary to have a test print of shoeprint in the database. Furthermore we have developed a standard classification system with the police. It contains all shapes that can be found on shoes, like circles, triangles and the kind of classes. In each class there is a subclass to specify the shape of the subclass.
The classification takes time and examiner will differ in their way of classifying shoeprints, and approaches have been made to automate this. We have tested several algorithms for automating this.
First of all the shapes should be segmented in different shapes that are visible. And after this the shapes should be classified automatically. For basic forms (triangles, circles etc) this method appeared to work with Sammon Plots of Fourier Descriptors [Geradts, 1995][vi]. The decision for the shape recognition is done with a neural network. Currently there is an interesting research project on classification of complete shapes by fractals [Alexander, 2000].[vii]
To automate this kind of search for real shoeprints, much more work has to be done. Often real shoeprints are weak in their appearance. Most often these searches will result in a list of interesting shoes, which might be compared manually for damages and other features that might result in identification.
3.3 Cartridge Cases
3.3.1 Introduction
In the Forensic Science Laboratory in the Netherlands a research study has been carried out for automated comparison algorithms of cartridge cases. This study is a part of an evaluation of the different systems, which exist on the market for databases of cartridge cases and bullets.
The reason for us to compare the different methods of image matching is that these methods are proprietary. For use in a forensic laboratory it is important for quality assurance to understand why a certain image is not found in top matching ranks and to have more background in the image-matching engine. Another reason for this research is to improve the results of image matching.
3.3.2 Forensic Examination

 When a firearm is loaded and fired the
mechanisms and part in the firearm that come into contact with the cartridge
case cause impressions and striations that can be characteristic for the
firearm being used. The striation marks on bullets are caused by the
irregularities in the firearm barrel as well as larger and more distinct land
and grooves of the rifling.
When a firearm is loaded and fired the
mechanisms and part in the firearm that come into contact with the cartridge
case cause impressions and striations that can be characteristic for the
firearm being used. The striation marks on bullets are caused by the
irregularities in the firearm barrel as well as larger and more distinct land
and grooves of the rifling.
The cartridge case ejected shows marks (figure 9) that are caused by the firing pin and the breech face as the cartridge is repelled back in the breach by the force of rifling. The feeding, extraction and ejection mechanisms of the firearm will also leave characteristic marks.
In the Forensic Science Laboratory these marks on cartridge cases and bullets are compared with the test fired ones. Often the cartridge case is the most important forensic specimen in the identification of weapons, as bullets are commonly deformed by the impact. The examiner can also determine, using class characteristics what kinds of firearm or which make and model have been used.
This study handles different approaches for automated image matching algorithms on image databases of breach face and firing pin marks.
3.3.3 Ballistic Imaging Systems
DRUGFIRE and IBIS are databases that can be used for acquiring, storing and analyzing images of bullets and cartridge cases. These two systems have been evaluated at our laboratory.
Both systems capture video images of bullet striations and of the markings left on cartridge cases. These images are used to produce an electronic signature that is stored in a database. The system then compares this signature to that of another fired bullet or cartridge case - or to an entire database of fired bullets and cartridge cases.
Both systems have image matching algorithms. The methods of image matching applied in these systems are not known. However patents applied by Forensic Technology describe state-of-the-art image matching methods. The system of IBIS is now used most often, and since the images are acquired in a reproducible way by a special kind of lighting, the ring light, this system will result in the best matching results.
For evaluation of these systems it is important that the user has a hit list (the order of the most relevant image matches that are displayed) that is reliable.
Other systems that have been described on the market are the system Fireball, the French system CIBLE and the Russian system TAIS. These systems also use image-matching techniques.
3.3.4 Test database
For our evaluation of image matching algorithms we studied two kinds of images (Figure 10):
Figure 11 : Original image (left) and processed image (right)

· Images of breech faces that
are illuminated with side light
· Images of firing pins that are illuminated with ring light
Since firing pins can rotate in the firing pin depending on the firearm used, the firing pin mark is sometimes in a different position to the breech face mark.
We used a database of 4966 images, which were acquired using the Drugfire system under different circumstances (light sources and several views of the cartridge case). We tested the algorithms on all images (without prior knowledge). Since the firearm examiner is used to side light images, we focused the research to the side light images.
The user will enter the cartridge case in the database for comparison, and can limit the search to using Meta data (e.g. caliber, date limit).
We have a matching pair's test of fired cartridge cases. These matching pairs are from practical cases in the Netherlands, were the examiner has found a positive match between the firearm and the cartridge found at the scene of the crime.
The database consists of side light images of 49 different cartridge cases that have a known match. They are consistent in light conditions. These cartridge cases are fired from 19 different firearms of caliber's 9 mm Parabellum (15), .45 automatic (2) and .32 / 7.62 (each one). Depending on the case, there were 1-5 matches between the cartridge cases. Some of these cartridge cases are from different test shots. The marks of the cartridge cases and the shapes of the firing pin were visually similar between the matches. These cartridge cases can be mixed with the rest of the database for the experiments with large databases. Five cartridge cases had a rotation of more than 10 degrees to each other. The 49 cartridge cases were also available as ring light images of the firing pin. There were marks in all ring light images of the firing pin that could be distinguished from each other visually.
All of these images have been digitized with a standard protocol, in which the cartridge case is always positioned in the same way, and are optimized for sidelight.
3.3.5 Image matching Methods
In our research we assumed that there are no time constraint in the computation. So, this means that brute force methods can be used. The reason for this is that at first we try to use methods that are solid, and afterwards this method might be combined with faster approaches.
Preprocessing
Since the conditions for digitization differ slightly, it is necessary to do
some preprocessing of all images in the database. We did equalization and a
normalization of the gray values of the images. After that we deleted the area
outside of the primer, since this we would like to compare just the primer.
Selecting a circle in the center of the image does this; the rest has a gray
level 0 (figure 11)
Difference of two images
For a computationally simple kind of comparison we take the variance of the difference in gray values between two images (which is also used in previous research [Geradts, 1995][viii]).
Sort this variance and the hit list is defined for the lowest variance. This approach is also possible with the image-matching coefficient, which is a better statistical approach. This will be looked at in the next section.
Invariant Image Descriptors
A classical technique for registering two images with translation misalignment involved calculating the 2D cross-image matching function [Anuta, 1970][ix]. Image registration algorithms are important for this kind of research, since the position of the marks is not known.
The maximum of this function yields the translation necessary to bring the images into alignment. This function has the disadvantage of being sensitive to rotation and scale change. Even small rotations of a few degrees can reduce the peak of the cross image matching function to the noise level.
By using the invariant image descriptors in place of the original images, it is possible to avoid this problem. One such descriptor is the log-polar transform of the Fourier magnitude, which removes the effect of translation, and uniform scaling into depended shifts in orthogonal directions [Casesent, 1976] [x] The optimal rotation angle and scale factor can be determined by calculating the cross-image matching function of the log-polar transformed Fourier magnitudes of the two images. In our experiments we used 128 x 128 samples. This is adequate for the computational speed, whereas the details are still used.
Selecting features by tracking (KLT – method)
There are extensive studies of image matching for tracking [Shi, 1994][xi]. Since tracking has many similarities with searching in a database of images, these kinds of methods can also be used for their speed. The features that are of interest are followed. Determining if a feature is of interest can be used for ranking it in a hit list.
Tracking also has the problem of registration, since the camera might move, with image intensities that change in a complex way.
One of the methods that appear to work for a wide range of tracking problems, and that works fast, is the Kanade Lucas Tomasi (KLT) method [Bres, 1999] [xii]. Good features are located by examining the minimum eigenvalue of each 2 by 2-gradient matrix. The features are tracked using a Newton-Raphson method of minimizing the difference between the two windows. Multiresolution tracking allows for even large displacements between images.
For comparison of images the number of points that could be tracked between two images is used as a measure for determining the top positions in the database.
3.3.6 Discussion
We tested different image matching algorithms for marks on cartridge cases, using 19 matching pairs. For each pair several firearm examiners determined that they were shot with the same firearm.
In cases where the registration, and the light conditions among the marks in the cartridge cases was reproducible, a simple computation of the standard deviation of the subtracted gray levels put the matching images on top of the hit list. For images that were rotated and shifted, we have built a "brute force" way of image translation and rotation, and the minimum of the standard deviation of the difference is computed. For images that did not have the same light conditions and were rotated relative to each other, it was useful to use the third scale of the "à trous"-multiresolution computation.
It appeared that this method worked if the images of the firing pin marks are similar. The images of the firing pins are sensitive to variations in light condition. The "brute force" method takes much processing power and took 1 month to compute on a Pentium II-computer for 49 cartridge cases.
The ring light images were much more reproducible in image matching. The multiscale computation was not needed. All these images were correlated in the top position of the hit list with the brute force way of image matching and with the log polar measure. As the shapes of the region of interest are circular it is convenient for calculating in polar coordinates for computational reasons when using the difference method.
The log polar method works well in combination with the third scale and the ring light image. The computation time is seven days for a complete database of 4196 images.
A fast pre-selection method is carried out that is based on the KLT tracking equation. The details in the images that are prominent are selected in points. From each image these points are calculated one time and stored in the database. Then the position of those points is compared as a signature. In this way often the images that are most relevant are in the top positions.
For further improvement, it might be useful to have the refinement in which the user selects the areas that are relevant on the cartridge case for their marks. Sometimes the firearm examiner can have more information that some marks on the cartridge cases are damages that are not caused by the firearm.
The preprocessed images with the third scale à trous wavelet in combination with the log polar transform worked best and were fast for the database. To improve the speed of image matching the KLT-method could be used first for the top five percent for a faster pre-selection. The images and image matching methods that are used have marks that can be distinguished visually. For a large-scale evaluation it is necessary to modify the image matching method based on the information content of the mark.
With this method it is not possible to find a match if there are no visible breech face marks, however the ring light images might give results if the firing pin marks can be distinguished. Otherwise other marks on the cartridge case should be used.
The use of optical processors or parallel processors implemented in hardware is an option to improve the speed of the image matching.
3.4 Database of Drugs pills
Drugs pills (e.g. XTC) cases are submitted to the laboratory for forensic investigation. For information about manufacturers of the illegal drugs, a database is available with images of the drugs pills and information about the chemical composition. Often the manufacturer of the pills will have stamps with logos on these pills (figure 12). A study is conducted of different ways of contents based image retrieval of the logos.
The correlation method for this database should be easy to
use, and invariant to rotation of the drugs pill in the database. Since the
drugs pills are visualized with a standard camera with a side light source, two
images of the same pill may differ due to light variations. Another
problem is that the pill or the logo can be damaged, and the logo is not
visible anymore. Since the logo itself is three dimensional, and is captured
with a regular camera, the resulting 2D-image has to be compared. The
correlation method should be insensitive to the above factors.
The methods that have been evaluated and compared are:
· The standard correlation method that is used in the QBIC-database of IBM
· The standard correlation methods that are available from MPEG-7 research
· Other commercial software (Imatch)
· Own methods (log polar registration
For the correlation method it is important to have an
appropriate way of
feature extraction. It appeared that
with the standard correlation of
features in QBIC and Imatch, the images
that were the same and rotated
were not all of them in top position
(except if correlated on color).

Figure
12 : Logo database of drugs pills
The use of contour-based shape that was available in the
MPEG-7
resulted in most optimal results. This method uses the Curvature Scale-Space
representation, which captures perceptually meaningful features of the
shape.
4 Future work
There exist many different approaches for searching in image databases. For each kind of forensic image database, an appropriate method should be selected. Other databases that are under research are databases of faces, with the use of eigenfaces. The development of new algorithms that are faster, and implementation of search algorithms in hardware, might give new developments in these systems.
Also biometric systems will give more information for forensic science. An example of biometry is of course fingerprints, however there are many other kinds of research projects going on, e.g. gait, ear prints, retinas. For forensic investigation image databases can be important to validate the conclusions that are being drawn. An example of this is in the case of the uniqueness of ears and ear prints. In Dutch court this kind of evidence is challenged, and there should be more research to have a more statistical background on uniqueness.